Generating Quadtree Pixel Art w/ GoLang
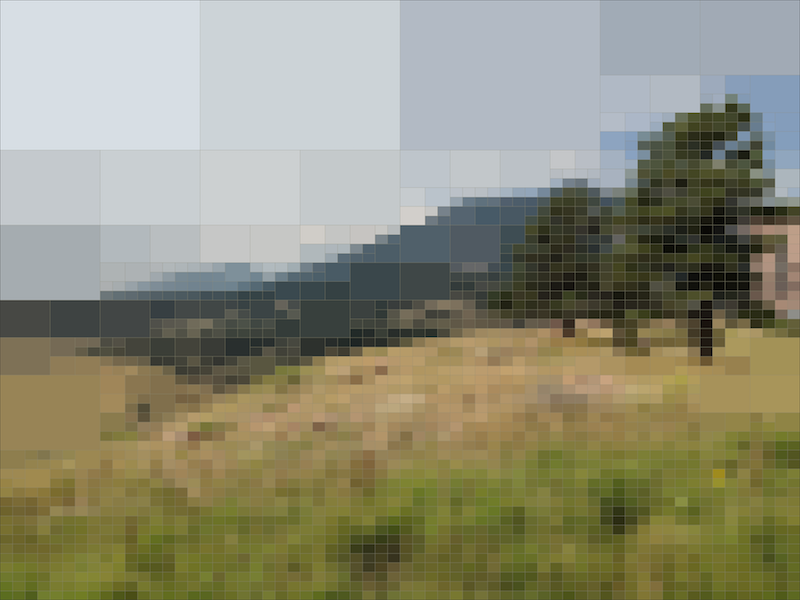
Quadtrees
Quadtrees are a tree like data structure where each node has 0 or 4 children. Quads have a few use cases including collision detection, spatial indexing, and image processing. Wikipedia’s Quadtree entry has a decent overview. If you’re looking for a more interactive introduction, definitely check out Jim Kang’s - An interactive explanation of quadtrees.
See more of my sample images below
Generating Quadtree Art
The basic idea is that you recursively divide an image into 4 quadrants. For each subquadrant, see if there’s enough color differentiation to warrant subdiving that quadrant. If there’s not enough color difference, fill it with that quad’s average color.
threshold := 0.2
for child in quad.children
  # color_difference returns the amouot of color differentiation for the quad
  if child.color_difference() > threshold
    subdivide(child)
  else
    child.color = child.get_avg_color()
Calculating Color Difference
We use the Color Difference to compare against our threshold value. When the color difference is greater than the threshhold, we need to subdivide this quadrant into four more quads.
To calculate the color difference, loop through all the pixels in this quad and add up all the RGB color values.
Divide the total amount of color (colorSum) by the number of pixels to get your average color distance.
func (q *quad) calcAvgSimpleColorDistance() {

  var colorSum float64

  for y := q.y; y < q.y+q.height; y++ {
    for x := q.x; x < q.x+q.width; x++ {

      r, g, b, _ := (*q.img).At(x, y).RGBA()

      colorSum += math.Abs(float64(int32(q.color.R) - int32(r>>8)))
      colorSum += math.Abs(float64(int32(q.color.G) - int32(g>>8)))
      colorSum += math.Abs(float64(int32(q.color.B) - int32(b>>8)))
    }
  }

  q.colorDelta = colorSum / float64(3*q.width*q.height)
}
Calculating Average Color
The average color of this cell is used as the fill color and as the default color of the grid lines.
To get the average color for the quadrant, add up all the channels (R,G,B) for each pixel individually. Then divide the total amount for each channel by the size of the area.
type histogram struct {
  r, g, b, a uint32
}

func (q *quad) calcAvgColor() {

  h := histogram{}

  for y := q.y; y < q.y+q.height; y++ {
    for x := q.x; x < q.x+q.width; x++ {
      r, g, b, a := (*q.img).At(x, y).RGBA()
      h.r += r >> 8
      h.g += g >> 8
      h.b += b >> 8
      h.a += a >> 8
    }
  }

  area := uint32(q.width * q.height)
  h.r = h.r / area
  h.g = h.g / area
  h.b = h.b / area
  h.a = h.a / area

  q.color = color.RGBA{
    uint8(h.r),
    uint8(h.g),
    uint8(h.b),
    uint8(h.a),
  }
}
Usage
If you want to generate your own images, use go get!
$ go get github.com/bwiggs/quadtree-art
$ quadtree-art -h
Usage of ./quadtree-art:
  -bc string
    	border color (hex) (default "333333")
  -g	render grid lines
  -gc string
    	grid color (hex)
  -l int
    	max recursive levels (default 7)
  -m int
    	minimum size a block can be (default 1)
  -o string
    	output file name with extension (default "quad.png")
  -t float
    	color difference threshold (default 25)
More Quadtree Resources
Quads - Michael Fogleman - Michael inspired me to build my own version of his quads project. He also got his working with different visual shapes, instead of squares to represent the quads. He also has a pretty neat web version.
An interactive explanation of quadtrees. - Jim Kang - Jim probably has the best write up on quadtrees. He does a great job of explaing how they work with alternative visual representations.
Spatial Indexing with Quadtrees - Oyewale Oyediran - Oyewale goes in depth on how Quadtrees can be used for gepspatial problems. Really great examples using Uber and other scoial networks.
Damn Cool Algorithms: Spatial indexing with Quadtrees and Hilbert Curves - Nick Johnson - Nick covers quadtrees and how they work with Hilbert curves.
Gallery
Here are some other images I generated using this tool.
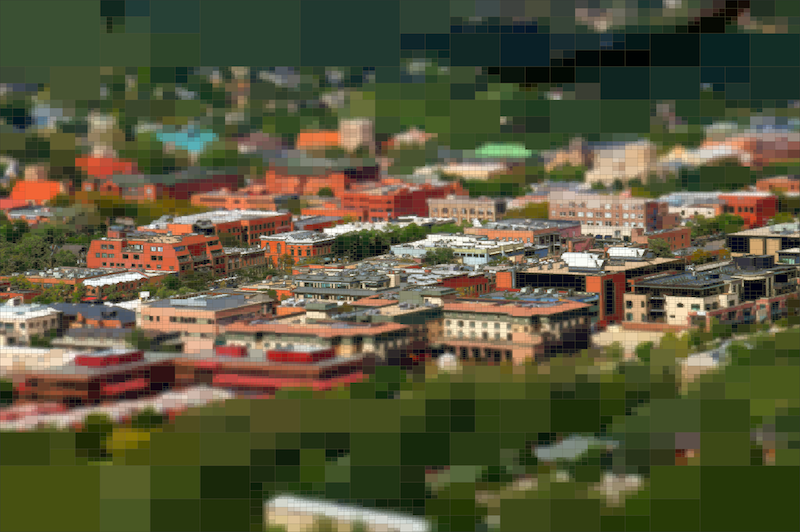 Pearl Street - Boulder, CO
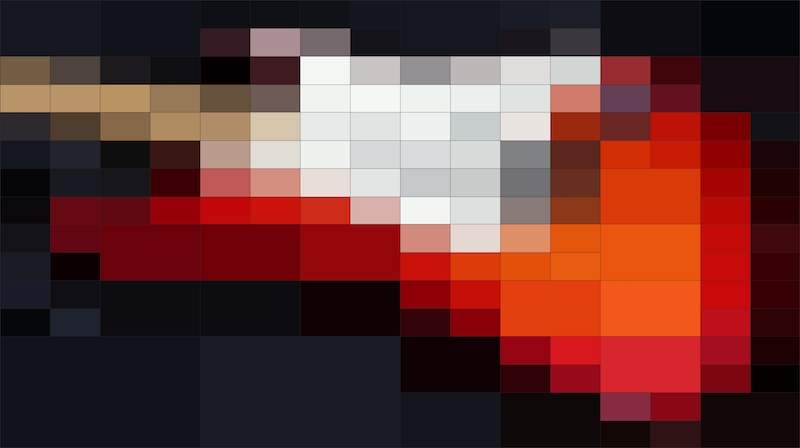 Fender Stratocaster Guitar
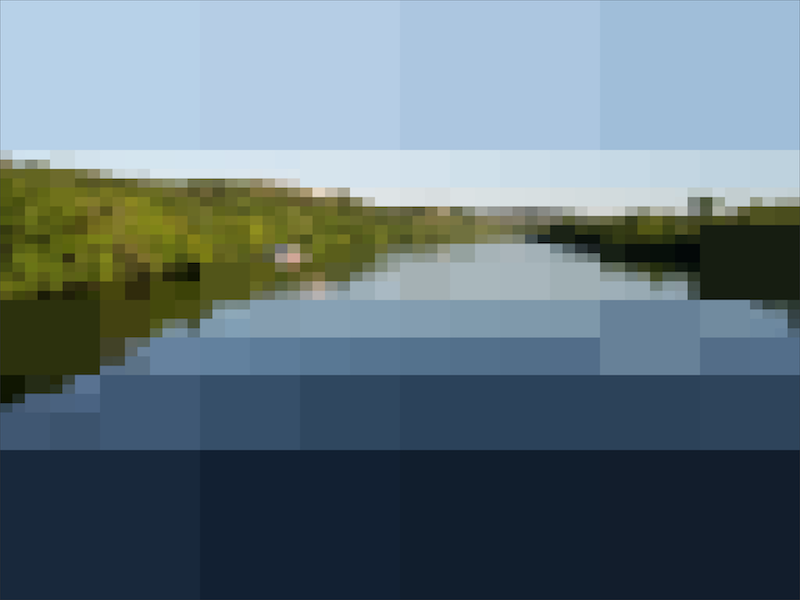 Lady Bird Lake - Austin TX
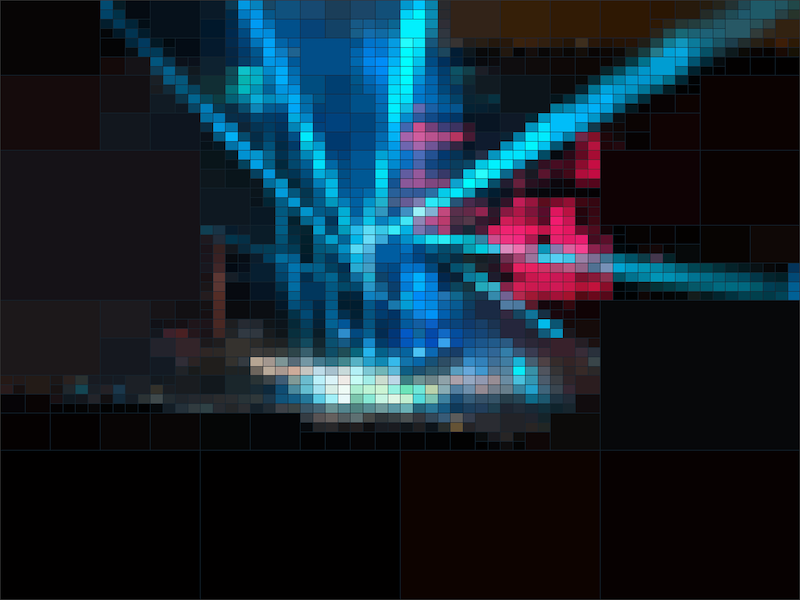 Rodrigo y Gabriella Concert - Red Rocks, Morrison, CO 2018
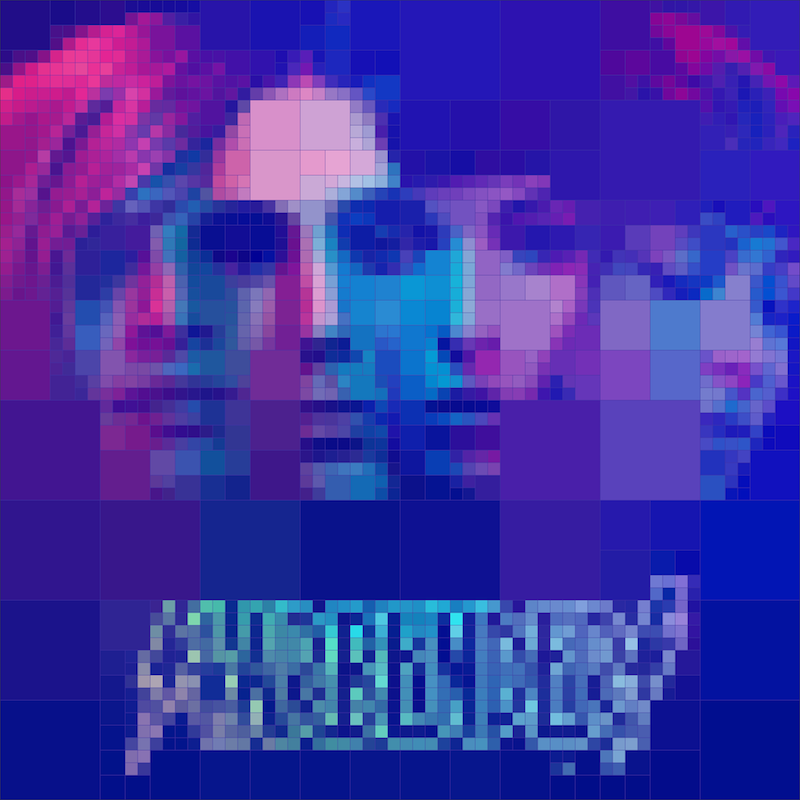 Starbenders - Julian Album
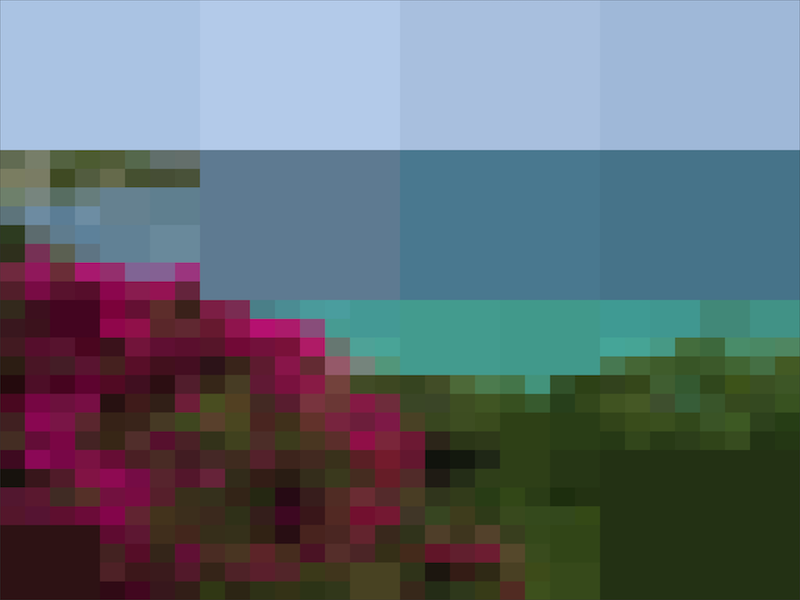 St Thomas, BVI
 NCAR - Boulder, CO


