Stock Market Dashboard with Vue.js
Visualizing stock market data using Vue3 and Yahoo Finance API
Overview
I built this to both help visualize market data and play with the vue3 composition api and deployment using Docker on AWS’s App Runner and Container Registry services. Unfortunately, in May 2023, Yahoo Finance disabled anonymous usage of most of their useful api endpoints which broke this app.
Gallery
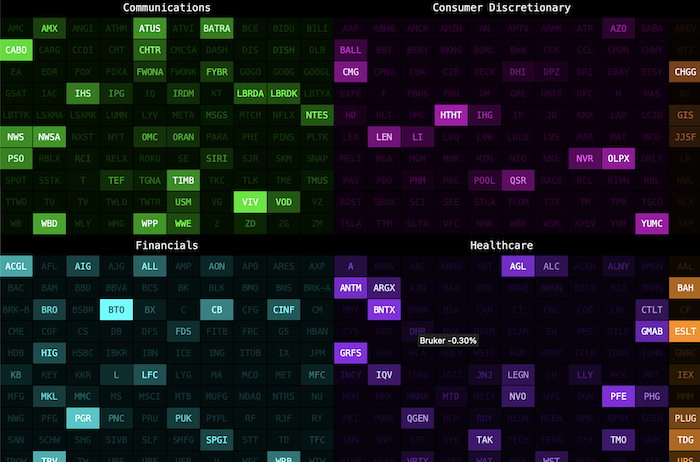
 A green day on wallstreet showing the top 100 stocks by market sectors
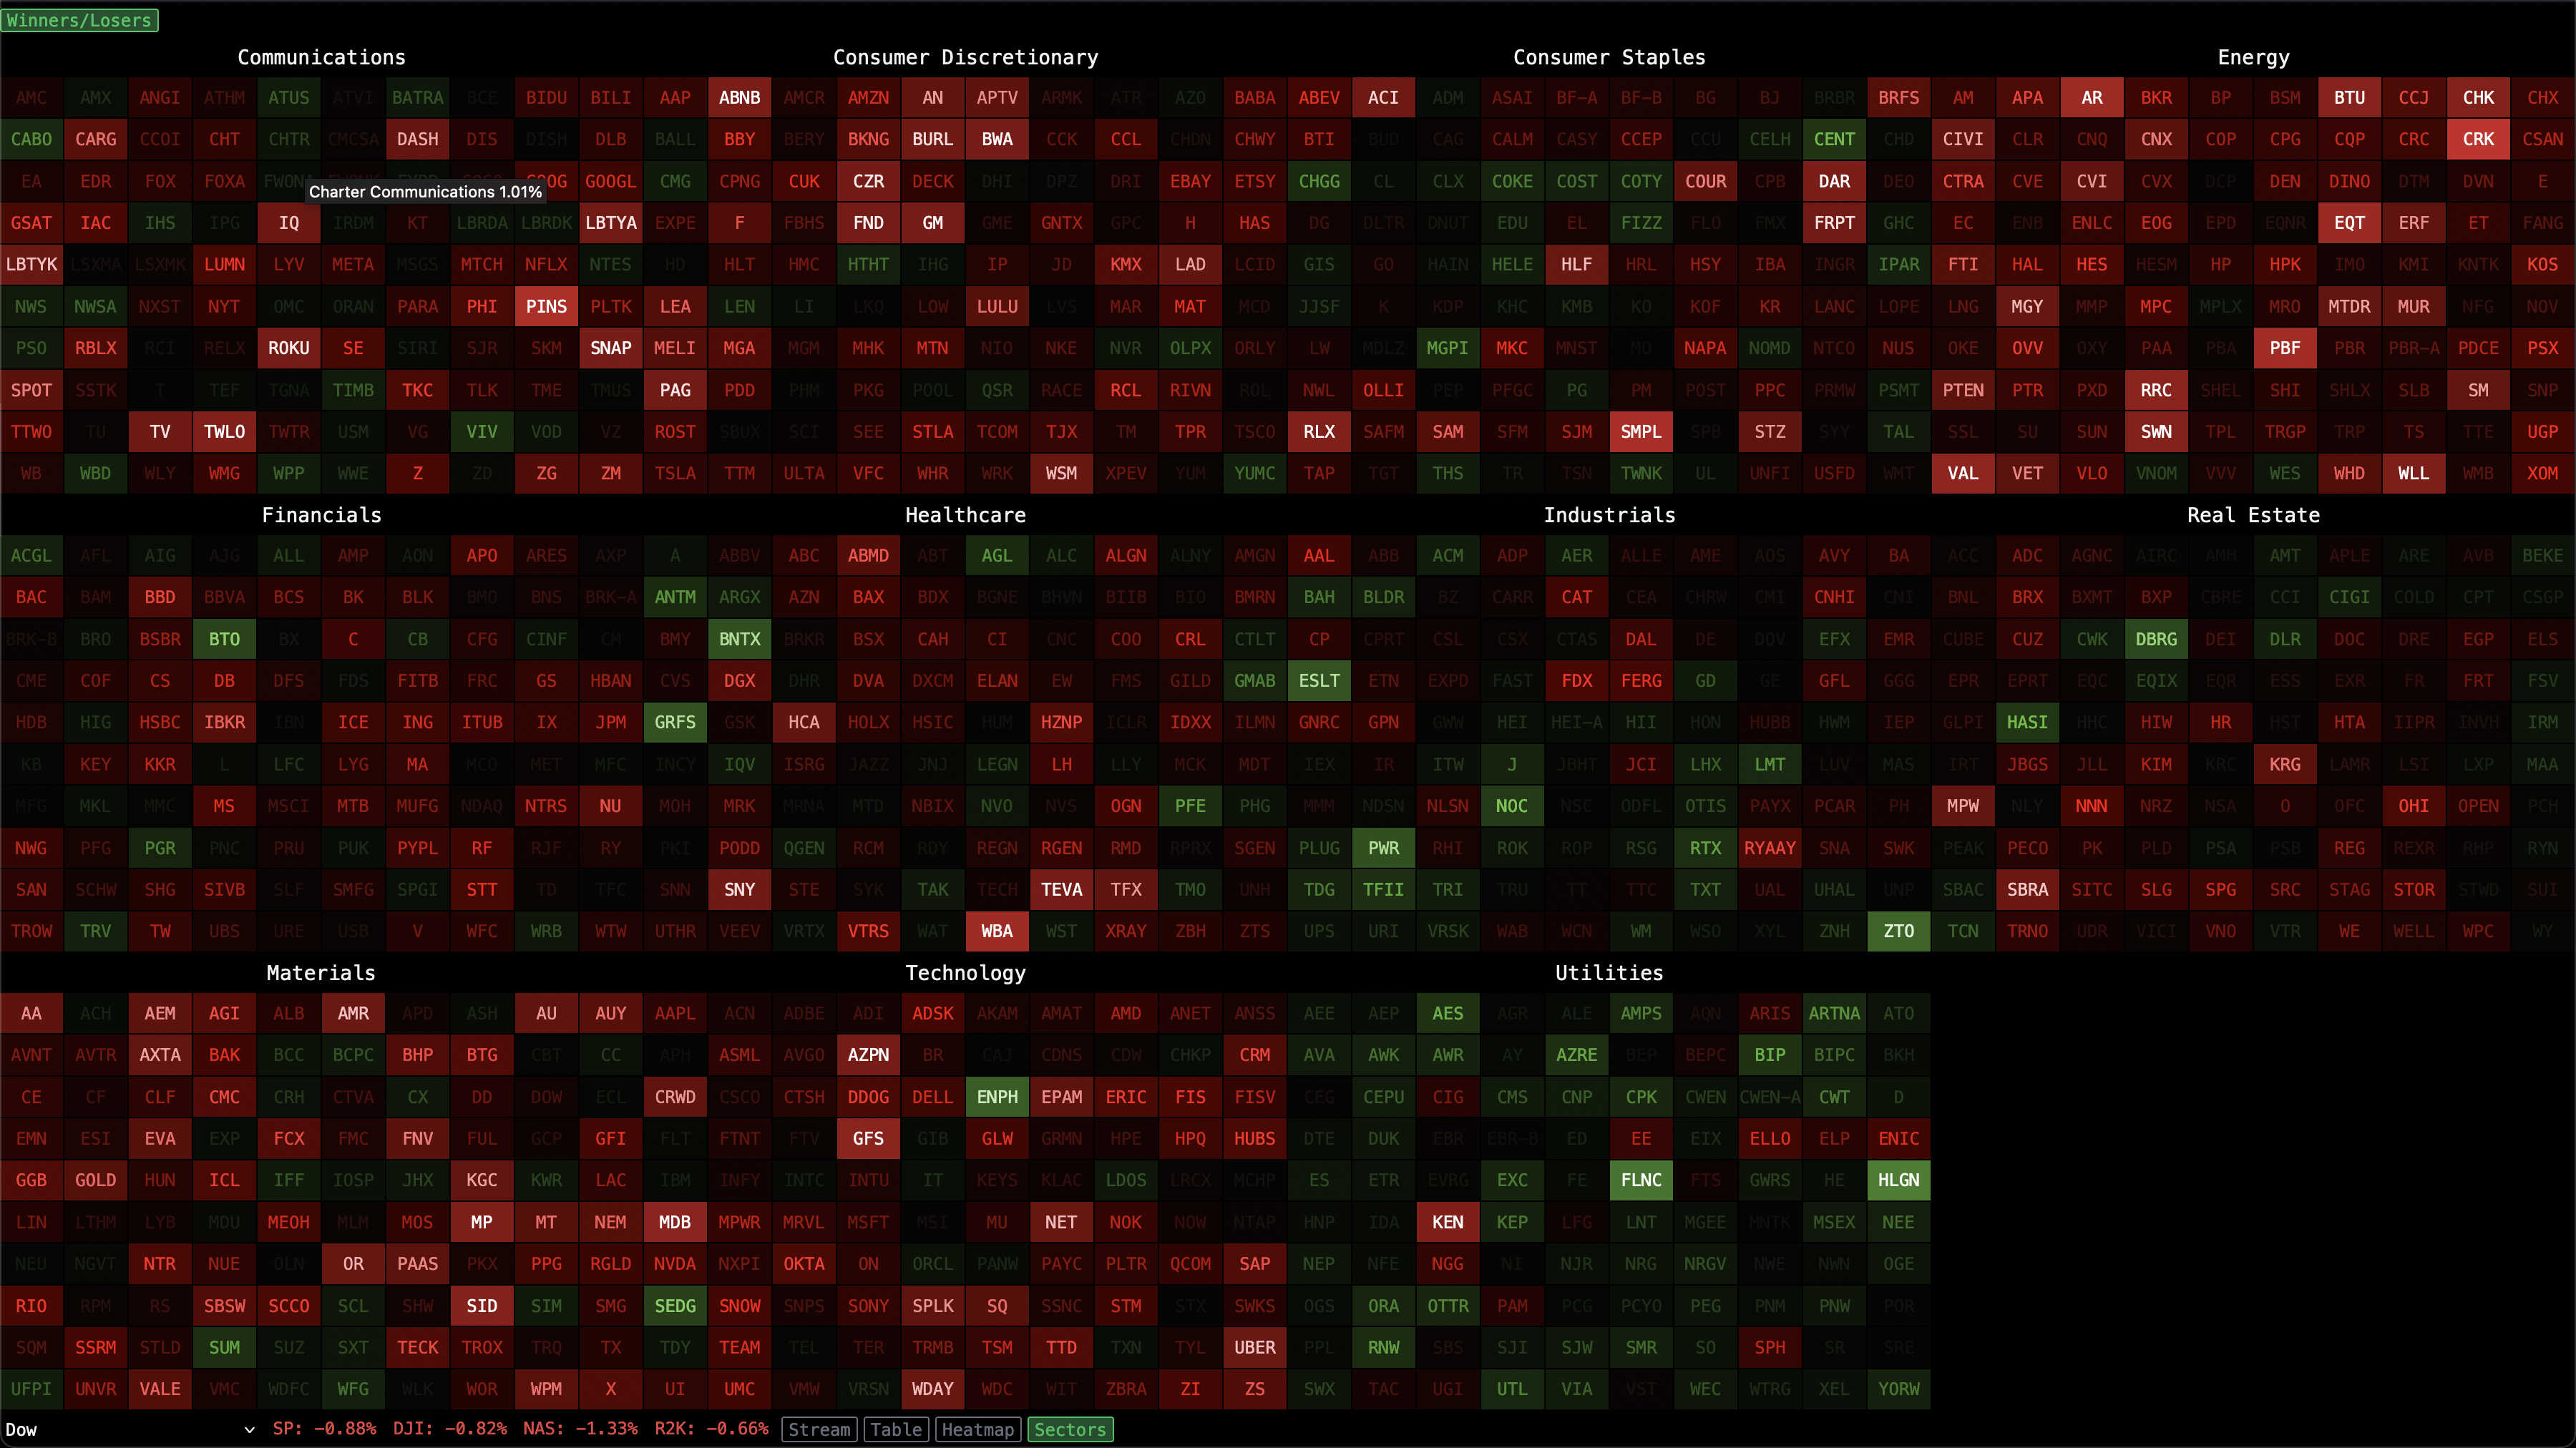 A mixed day on wallstreet showing the top 100 stocks by market sectors
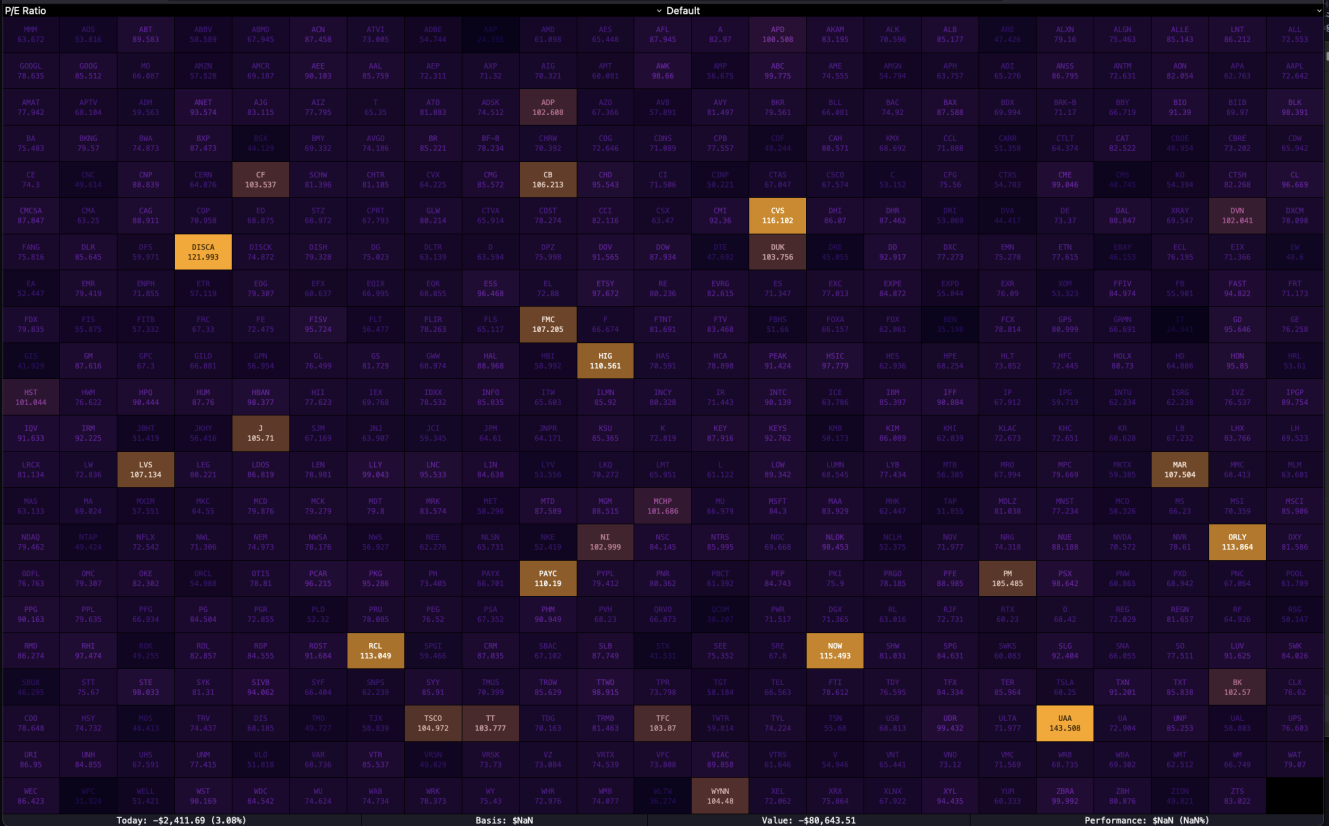 Visualizing P/E market data for the SP500
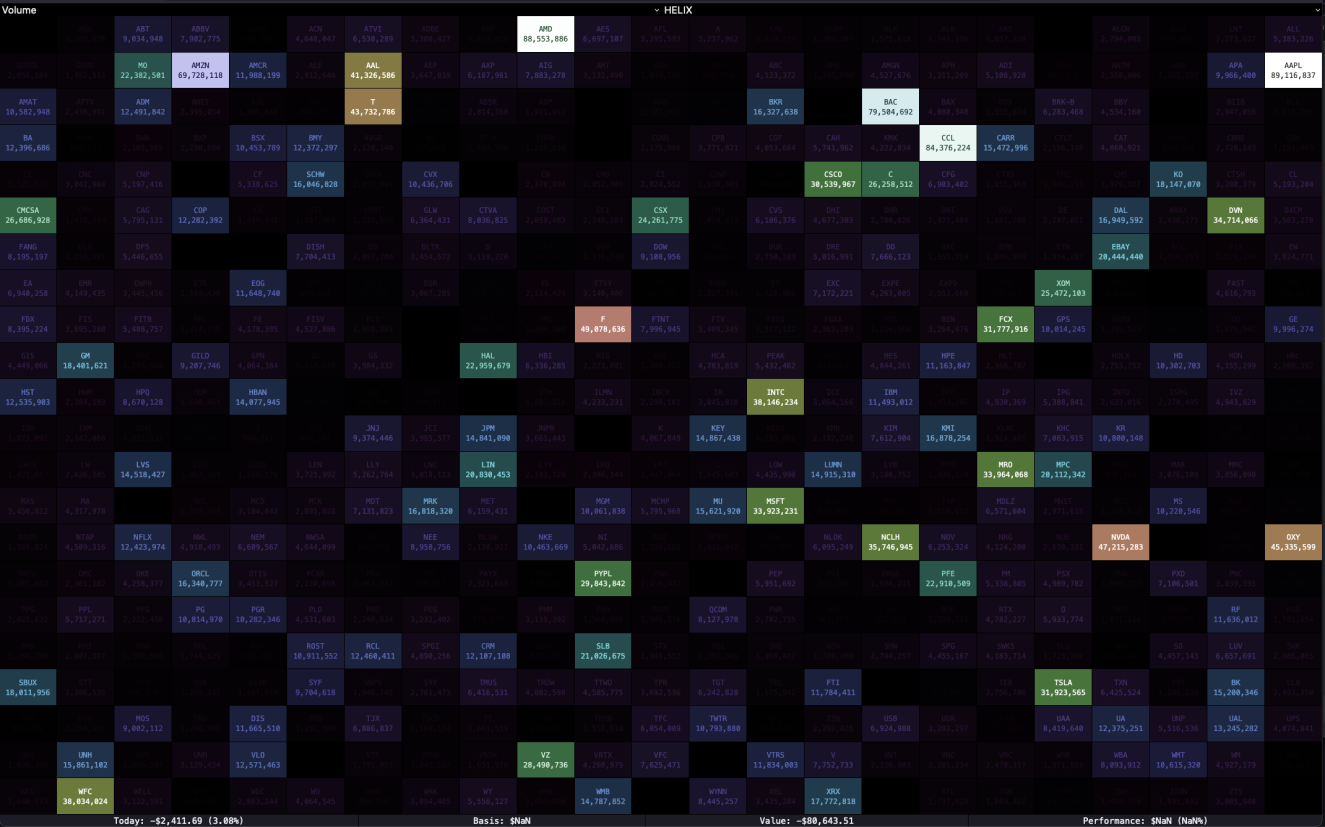 Visualizing Volume data for the SP500 using the Helix color scheme.
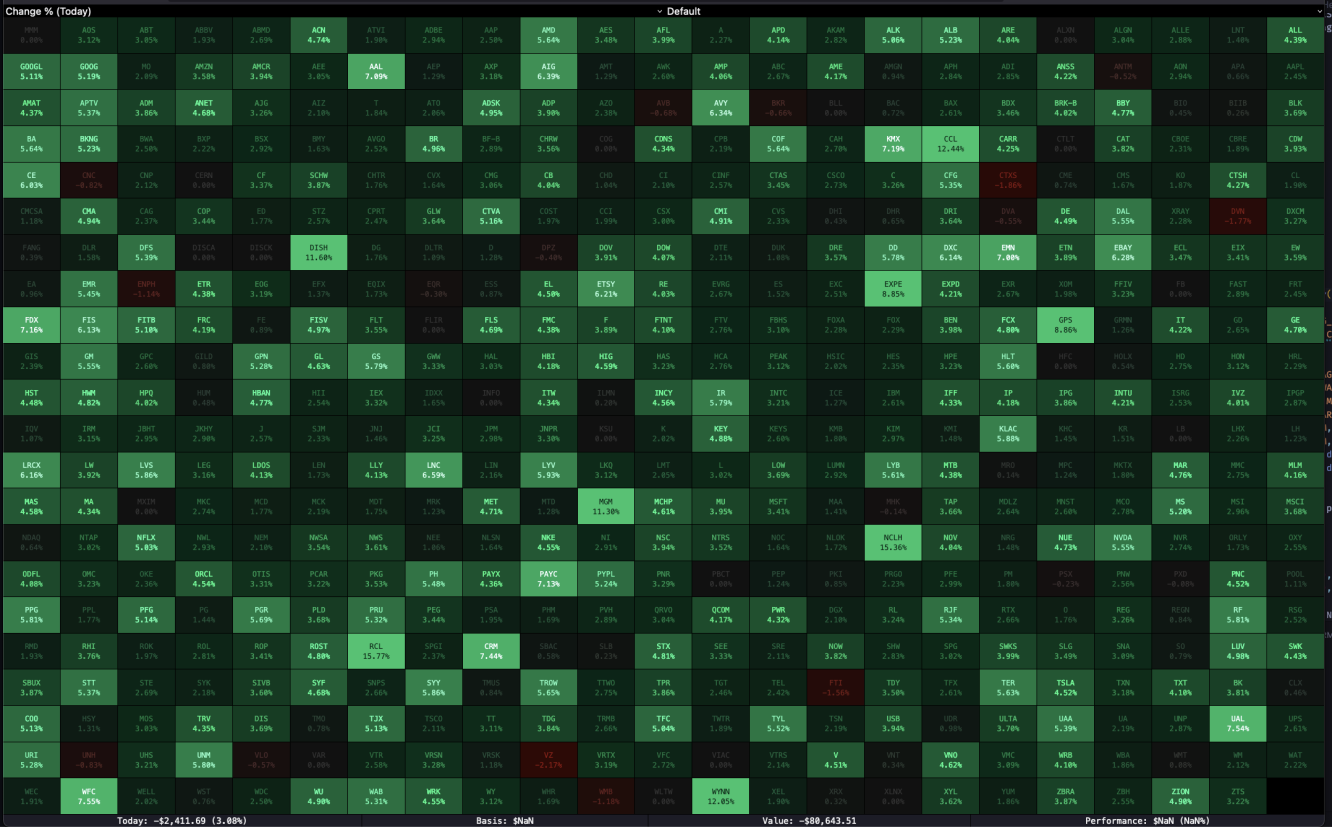
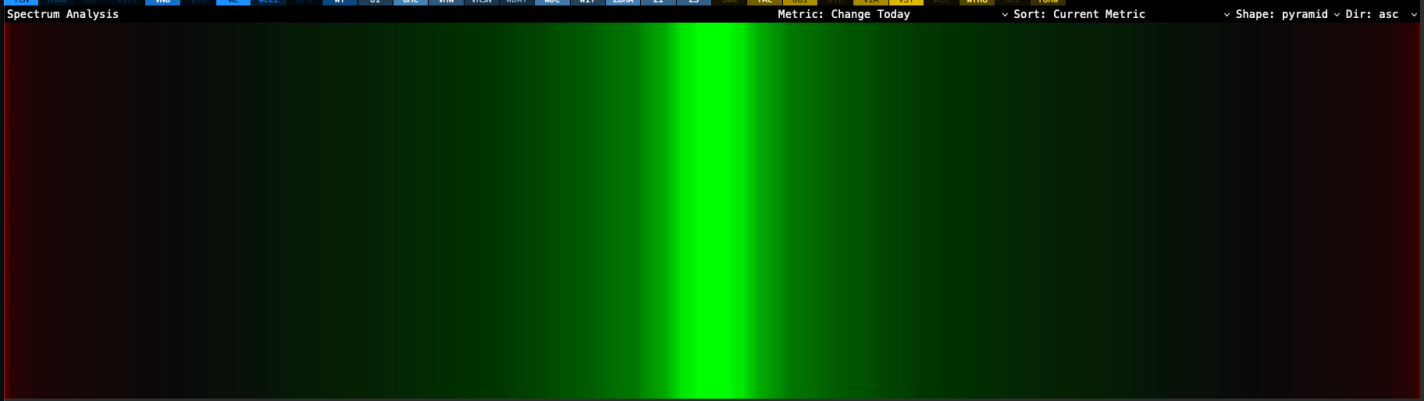 Experimenting with a spectrum analyzer style interface to view the SP500 days performance. Each holding is represented as vertical bar. Winners are centered, losers are on the edges. This shows the market was up mostly on the day.


