Plotting Big-O with gnuplot
Use gnuplot command to run a plt file and ouput a png file.
gnuplot bigo.plt
# File: bigo.plt
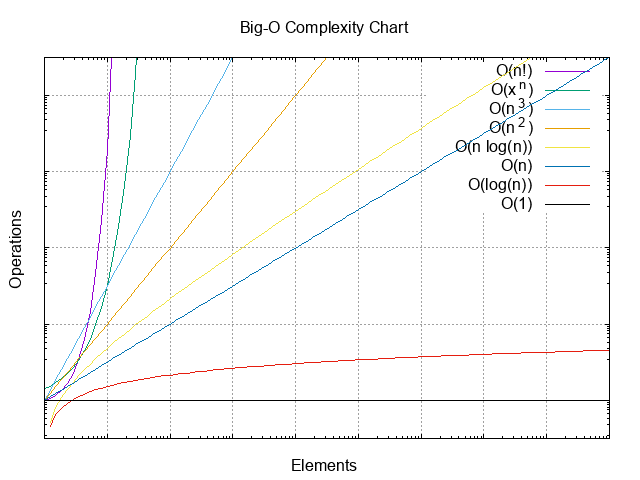
set title "Big-O Complexity Chart"
set output "bigo.png" # output file name
set term png # output as PNG
set grid # show a grid
set xlabel "Elements"
set ylabel "Operations"
set format xy "" # hide axis ranges
set xrange [1:1000000000]
set yrange [0:1000000000]
set logscale xy # logarithmic scale for x and y
set style line 1 lw 5
plot\
gamma(x+1) title "O(n!)",\
(2**x) title "O(x^n)",\
(x**3) title "O(n^3)",\
(x**2) title "O(n^2)",\
x * log(x) title "O(n log(n))",\
x title "O(n)",\
log(x) title "O(log(n))",\
(1) title "O(1)"
Autobuild
I wrote bigo.plt in vscode and found it helpful to open the output png file in a second pane. VSCode will rerender the image when it changes. Use the following command to rebuild the png when you save the plt file.
while inotifywait -e close_write bigo.plt; do gnuplot ./bigo.plt; done


