Homelab: Hot Aisle Temp Sensor and Dashboard
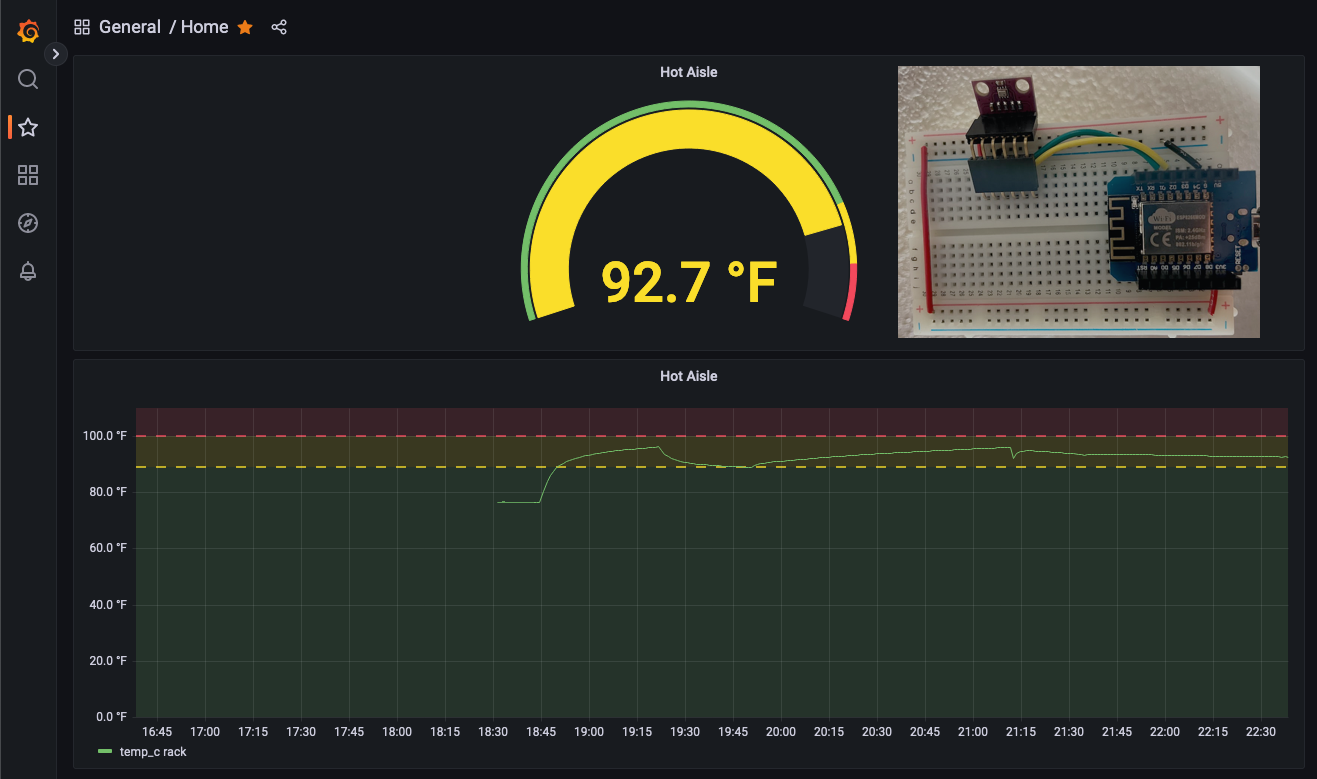
Today I decided to blow the dust off an unused WeMos D1 Mini (ESP8266 ESP-12F) and BMP280 tmep sensor to build a Hot Aisle Temperature Grafana Dashboard for my Homelab closet. In a Data Center, racks alternate between hot and cold aisles for better ventilation. In our house, it’s also known as “the back of the closet”.
Turns out, this closet actually runs pretty hot. With the door closed, temps can get close to 100°F, which is probably a bit too warm for the equipment. I’ll need to figure out a simple way to either get some more airflow around the rack or pipe it up into the attic somehow.
Setup
I used ESPHome to configure the ESP8266, BMP280 and HTTP POST request data push to InfluxDB. Grafana is configured to be able to access Influxdb to retreive data.
ESPHome
ESPHome was the real star of this project. With ESPHome, you declaratively configure a board, sensor and actions via YAML file. ESPHome takes that, figures out all the code it needs to generate and flashes a build onto the device. It can even do this via USB or WIFI OTA if your board supports.
podman container
I decided to run all of this via a podman container, in a Fedora Linux VM, on my M1 Macbook Pro. After fiddling with permissions between the linux usb device and the podman container, I ended up just disabling SELinux, cuz who needs it.
To start a webserver that can access your USB or device over wifi, I used the following:
$ podman run --rm -ti -p 6052:6052 --device=/dev/ttyUSB0 --group-app keep-groups -v ${PWD}:/config esphome
board.yaml
esphome:
  name: racktemp

esp8266:
  board: d1_mini

# TODO: make this thing go to sleep so I can run it off a battery.
# deep_sleep:
#   run_duration: 10s
#   sleep_duration: 1min

# Enable logging
logger:

# Enable Home Assistant API
api:
  password: "PASSWORD"

ota:
  password: "PASSWORD"

wifi:
  # TODO: Check out secrets.yaml to make this a bit more secure
  ssid: "WIFI_SSID"
  password: "WIFI_PASS"

  # Enable fallback hotspot (captive portal) in case wifi connection fails
  ap:
    ssid: "Racktemp Fallback Hotspot"
    password: "PASSWORD"

  # manual_ip:
  #   static_ip: 192.168.10.10
  #   gateway: 192.168.10.1
  #   subnet: 255.255.255.0

captive_portal:

i2c:
http_request:
  useragent: esphome/device
  timeout: 10s
sensor:
  - platform: bmp280
    address: 0x76
    update_interval: 60s
    temperature:
      id: rack
      name: "Temperature"
      oversampling: 16x

      # when we get a temp reading, make an http post request to influxdb
      on_value:
        then:
          - http_request.post:
              url: http://influxdb.example.com/api/v2/write?org=ORG_NAME&bucket=BUCKET_NAME
              headers:
                Authorization: 'Token TOKEN_HERE'
              # a few lines of C code to generate the influxdb request data
              body: !lambda |-
                char buf[64];
                sprintf(buf, "%0.1f", id(rack).state);
                return ((std::string) "temperature,location=comms_closet temp_c="+buf).c_str();
Grafana InfluxDB Query
from(bucket: "BUCKET")
  |> range(start: v.timeRangeStart, stop: v.timeRangeStop)
  |> filter(fn: (r) => r["_measurement"] == "temperature")
  |> filter(fn: (r) => r["_field"] == "temp_c")
  |> filter(fn: (r) => r["location"] == "rack")
  |> map(fn: (r) => ({ r with _value: float(v: r._value) *9.0/5.0 + 32.0}))
  |> aggregateWindow(every: v.windowPeriod, fn: mean, createEmpty: false)
  |> yield(name: "mean")


